Book of Mormon Forensic Stylometry
A 20-point forensic linguistic dashboard applying authorship attribution math, delta-scores, and word-frequency vector analysis to historic text.
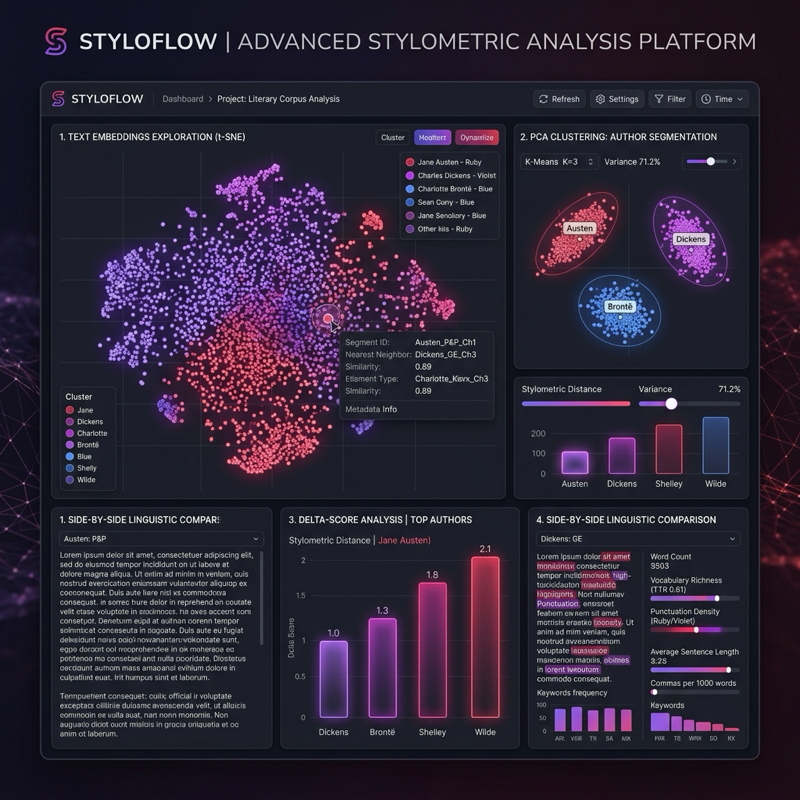
Book of Mormon Forensic Stylometry
This project is a 20-point forensic linguistic dashboard and analysis toolkit designed to evaluate the authorship and stylometric properties of the Book of Mormon. By applying quantitative computational linguistics, natural language processing (NLP), and multi-dimensional statistical models, the dashboard evaluates text segments against contemporary 19th-century works and candidate authors.
Computational Stylometry
Stylometry operates on the principle that every writer has an subconscious, unique “linguistic fingerprint.” This fingerprint is defined not by the major nouns and verbs they choose, but by their usage patterns of function words (e.g., the, and, of, by, with). Because function words are used automatically, they are incredibly difficult for an author to consciously alter or forge.
+-----------------------------------------------------------+
|                   NLP Raw Text Pipeline                   |
|  - Tokenization & Lemmatization                           |
|  - Sentence boundary detection                            |
+-----------------------------------------------------------+
                             |
                             v
+-----------------------------------------------------------+
|                Feature Extraction Engine                  |
|  - Relative frequencies of top 100-500 function words    |
|  - Average sentence and word length statistics            |
|  - Type-Token Ratios (Vocabulary richness)                |
+-----------------------------------------------------------+
                             |
                             v
+-----------------------------------------------------------+
|                 Linguistic Math Layer                     |
|  - Burrows' Delta (z-score difference calculation)        |
|  - Principal Component Analysis (PCA) dimensionality     |
|  - Cosine Similarity & Bootstrap Consensus Trees          |
+-----------------------------------------------------------+
                             |
                             v
+-----------------------------------------------------------+
|                 React & D3 Dashboard UI                   |
|  - PCA Cluster map (Interactive 2D/3D scatter plots)      |
|  - Rolling Delta charts                                   |
|  - Heatmaps of styling anomalies                          |
+-----------------------------------------------------------+
Key Analyses Implemented
1. Burrows’ Delta Authorship Attribution
Burrows’ Delta calculates the distance between a target text and a set of candidate comparison texts. It transforms word frequencies into standardized $z$-scores, measures the absolute differences between the candidate profiles, and computes an overall difference score. A lower Delta score represents a closer stylistic match.
2. PCA Dimensionality Reduction
To visualize high-dimensional word frequency vectors (often containing 300+ dimensions representing the top 300 function words), the engine applies Principal Component Analysis (PCA). This projects the data points onto a 2D or 3D coordinate space, clustering texts with similar styles.
3. Vocabulary Richness (TTR & Hapax Legomena)
Measures the ratio of unique words to total words (Type-Token Ratio) and counts words that appear only once in a text (Hapax Legomena). This helps evaluate the vocabulary diversity of different chapters compared to other works by the same or different authors.
4. Rolling Delta Analysis
Analyzes text in sliding windows (e.g., 5,000-word blocks) to identify stylistic shifts within a single document. This reveals if chapters were written by multiple distinct voices or if a single author’s style evolved over the course of the writing process.
Technology Stack
- Data Processing Backend: Python,
NLTK,pandas,scikit-learn(for vectorization, z-scores, and PCA calculation). - Interactive Dashboard: JavaScript/TypeScript, React, TailwindCSS, and
D3.js/Plotly.js(for interactive multi-variable charts).